Insights in 5 minutes

The Qlik Sense download site boasts: “In just 5 minutes you’ll be able to discover more insights into your data”.

We took that as a challenge.

Watch this video to see just how much can be achieved in the time it takes to boil an egg.

New to Qlik and wanting to know how to make a fast start?
Please contact us to find out how BIFocus can help.

A rose in November

The Great British weather never ceases to surprise us …. or nature. In my garden there’s a rose still happily flowering in mid-November.  

Less of a surprise is the fact that Qlik have released their Qlik Sense November 2018 Edition …. in November.

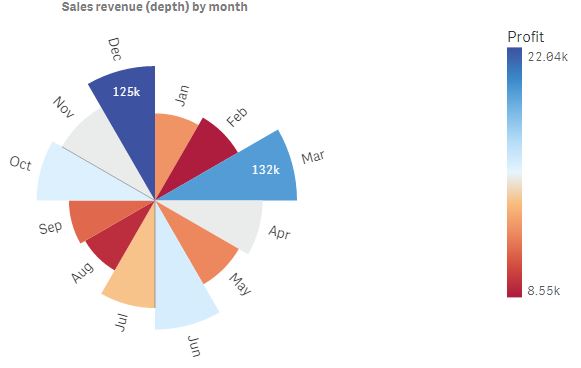
Amongst the additional function you’ll find a Rose Chart – an enhancement to the Pie Chart that allows the addition of a 2nd Measure which then determines the depth of the radius for that segment. One of the best use cases for this chart is in displaying a cyclical data series to aid comparison between the first and last entries in the series (the width can be set to a constant as shown).

More importantly, the November 2018 release has introduced significant additional function without compromising the intuitive look of the desktop for a first-time user.

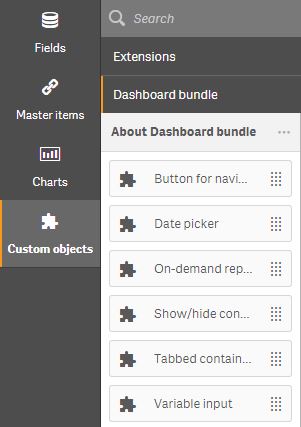
For example, there’s a bundle of 6 new, Qlik-supported, extensions. These include several functions well-known to QlikView users which facilitate date or variable inputs, navigation and control of visualisations displayed. These extensions can help create a guided-analytics application.  These extensions are only loaded if you select the Dashboard Bundle on installation – and then they are found (as shown) under the Custom objects icon. So, the desktop remains uncluttered by the new function, keeping the focus on finding insights. 

The extensions give greater control over what is displayed in the Sense app. For example, the Show/hide container can be used to avoid displaying an unhelpful visualisation. A simple “IF” statement will ensure that your Pies only display with 10 segments or less – or that your Scatters always have more than one plot. The Tabbed container enables the same area of the dashboard to be used for multiple purposes. For example, you may wish to display a chart – and then add a second tab that gives a table with a more detailed view. Or, different user groups may request different visualisations – the Tabbed container allows you to satisfy them all:

Combined with prior 2018 enhancements – the ability to set the Grid spacing (introduced in April 2018), to extend sheets (June 2018) and to turn off responsive design and set a custom sheet size (Sept 2018) – there’s now much finer control of the layout and display of sheets within a Qlik Sense app.

Continuing the theme of simplification, there’s an enhancement to the Insights Advisor that allows making minor edits to suggested visualisations (such as changing the dimension, measure or aggregation method) before adding the visualisation to the sheet.

If you’ve ever struggled with the Set Analysis syntax, then help is also at hand. In this release the Expression Editor will create Set Analysis script based on your current selections, bookmarks, or the newly introduced Alternate States.

So, in summary November 2018 introduces some helpful new functions without making the desktop more complex – a win-win for existing and new users alike.

For more information on the new features check out:

What’s new in Sense November 2018

Mike Tarallo’s 5-minute update

New to Qlik and wanting to know how to make a fast start?
Please contact us to find out how BIFocus can help.  


Should I stay or should I go?


Here are 7 reasons to consider moving some of your QlikView applications to Qlik Sense:

1) Working patterns have changed. In spite of the work-life balance mantra, people are more likely to want to consume and analyse data out of the office and outside the 9-5 day – whether that’s at a client site, during the commute home or after the kids have gone to bed.

2) The face of computing has changed. The screen size is no longer the default 1024*768 pixels offered by the standard office monitor. Users want the flexibility to engage with Qlik applications on laptops, mobiles and tablets – and that requires a responsive design, optimised for whatever device they are using.

3) Users have changed – data literacy is increasing. Just as there was a culture change from mining spreadsheets to QlikView applications that allowed data analysis, now there is another change as users demand the ability to be able self-serve – not only exploring their data but further developing the applications they use.

4) Use cases have changed. Organisations increasingly want to integrate elements of Business Intelligence into other applications. No longer is BI an after-thought, now its embedded into solutions to enable better decision making.

5) Hosting has changed. Data is now sourced form a myriad of environments – some on-premise, some from the cloud. BI may be consumed by employees on the intranet or customers, partners and suppliers via extranets. To support these requirements, a solution with more flexible hosting options makes sense.

6) BI is changing. The rise of the “citizen data scientist” requires that BI solutions offer Artificial Intelligence or Augmented Intelligence – automating elements of the data preparation and prompting users with the optimal visualisations for KPIs.

7) Qlik’s Dual-Use Licensing Offer. This enables existing QlikView users to benefit from Qlik Sense for an uplift in the QlikView annual maintenance charge.
For more detail on the offer, check Qlik’s community post
Or have a look at the “QlikView and Qlik Sense Together” Webinar

What’s your reason for wanting to migrate? Why not contact us to discuss the benefits, options and costs of migrating QlikView apps to Qlik Sense.

So, you got let me know – should I stay or should I go?
(with thanks to the Clash for the quote and helping us agonise our way through the 80s)

Grey Matters

Everyone who knows Qlik knows that that grey matters.

Grey represents values that are excluded by the current selections. Many insights may be hidden in the grey that would have been missed by a traditional data reporting tool.

Often the things we don’t do are as informative as the things we do:
“That’s strange …. it seems that Aberdeenshire, Angus, Argyll and Bute are the only counties where nothing has been reported”

The insight will spark further analysis – first to confirm that the data is correct (maybe the data load missed some counties) and then, assuming it is, to find an answer to that all-important question: Why?

We’ll keep updating this blog with informative articles, because GREY MATTERS.